Global gold ETFs register around $1.7b of record outflows in June
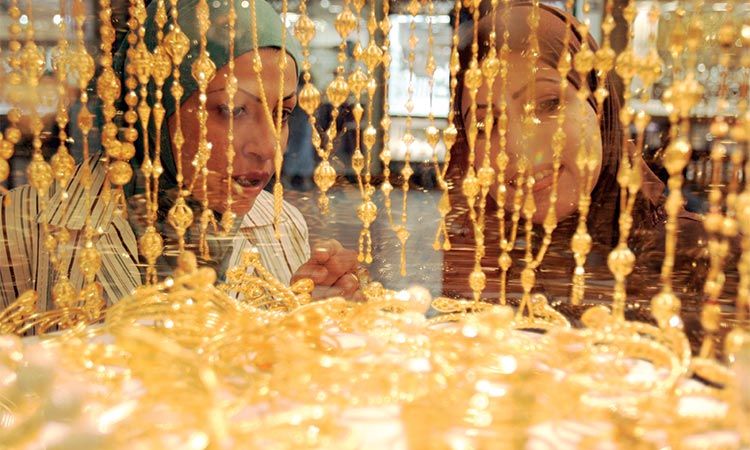
Women shop in the Dubai gold market, one of busiest jewellery markets in the Middle East. Agence France-Presse
Global gold exchange-traded fund ETFs registered 28t ($1.7b) of outflows in June. This was the second consecutive month of outflows, following the 53t that left these funds in May, according to the World Gold Council report. While the recent flows were enough to push Q2 into net outflows of 39t ($2b), year-to-date net inflows remained positive at 234t ($14.8b). Total holdings at the end of June stood at 3,792t ($221.7b), up 6% y-t-d.
North American and European funds were the only regions to see outflows in June. North American holdings fell by 26t ($1.5b), with outflows dominated by the largest and most liquid US funds. Intense focus on the future pace of interest rate hikes and a stronger US dollar were the primary headwinds for gold investment. European funds saw more modest outflows of 4t (US$245mn), concentrated in Switzerland, Germany and France. Despite the gloomy economic outlook for Europe, with record inflation and rising sovereign borrowing costs, the European Central Bank indicated it will raise interest rates in July – the first hike in more than 11 years – which weighed on sentiment. In the UK, holdings were up US$205.4mn even as the Bank of England increased interest rates for a fifth straight month.
Holdings in Asia rose fractionally (1t, US$66.1mn). In China, the range-bound gold price and local equity strength discouraged greater levels of gold ETF investment. In India, minor net inflows continued in June, primarily driven by market volatility and a depreciating rupee attracting investment into Indian gold ETFs. Holdings in other region were virtually flat month-on-month. 0F1
At a regional level, North American and European funds attracted the lion’s share of investment. In H1, US fund holdings rose by 133t (US$8.1bn) and European funds added 119t (US$7.5bn). Funds in ‘other’ regions rose by a marginal 2t. Asia was the only region to see net outflows over the first half of 2022, declining by 16t with Chinese funds the main contributor. While the bulk of Chinese outflows occurred during Q1, impacted by the New Year holiday and tactical trading into a rising gold price, lower gold price volatility and profit-taking led to further outflows in Q2.
Investors around the world face a challenging environment during H2 2022, needing to navigate a noxious compound of rising interest rates, high inflation and geopolitical risks. In the near term, the gold price will likely remain sensitive to real rates, the speed at which global central banks tighten monetary policy, and their effectiveness in controlling inflation. Read more in our Mid-year Outlook report.
Gold trading volumes and futures demand subdued in June Average daily trading volumes for gold totalled US$118.2bn in June, below the US$137.3bn average in May. Declines across OTC, exchanges and gold ETFs contributed to the m-o-m fall, although China was a bright spot with higher trading volumes on the Shanghai Gold Exchange and in Chinese gold ETFs in June. The latest Commitment of Traders (COT) report for Comex showed net long positioning declining marginally in June. In the week ending 28 June, net longs totalled 513t (US$30bn), down from 564t (US$33.4bn) at the end of May.
As of 30 June 2022. ‘Global inflows’ refers to the sum of changes of all funds that saw a net increase in ounces held over a given period (e.g., month, quarter, etc.). Conversely, ‘global outflows’ aggregates changes from funds that saw ounces held decline over the same period. Please note that the estimates for US dollar flows and the equivalency for changes in tonnes may diverge due to differences in the methodology used to compute each metric. For more information, see ETF Flows Data Methodology.
e calculate gold-backed ETF flows both in ounces/tonnes of gold and in US dollars because these two metrics are relevant in understanding funds’ performance. The change in tonnes gives a direct measure of how holdings evolve, while the dollar value of flows is a finance-industry standard that gives a perspective on how much investment reaches the funds. We have made a few adjustments and improvements to our calculation methodology as of 1 July 2021 that will impact historical and future data. Specifically, we revised the methodology used to estimate changes in gold holdings as described below:
Previously, changes in tonnes were calculated by converting a fund’s AUM (in USD) into gold holdings (in tonnes) and computing the difference over periods. However, currency movements and large daily and weekly gold price movements could distort the difference between tonnage change and US-dollar fund flows during short time horizons. We therefore adjusted
As of 30 June 2022. ‘Global inflows’ refers to the sum of changes of all funds that saw a net increase in ounces held over a given period (eg, month, quarter, etc.). Conversely, ‘global outflows’ aggregates changes from funds that saw ounces held decline over the same period. Please note that the estimates for US dollar flows and the equivalency for changes in tonnes may diverge due differences in the methodology used to compute each metric. For more information, see ETF Flows Data Methodology, the World Gold Council report said.